HAllA Legacy
Hierarchical All-against-All association testing (HAllA) is computational method to find multi-resolution associations in high-dimensional, heterogeneous datasets.
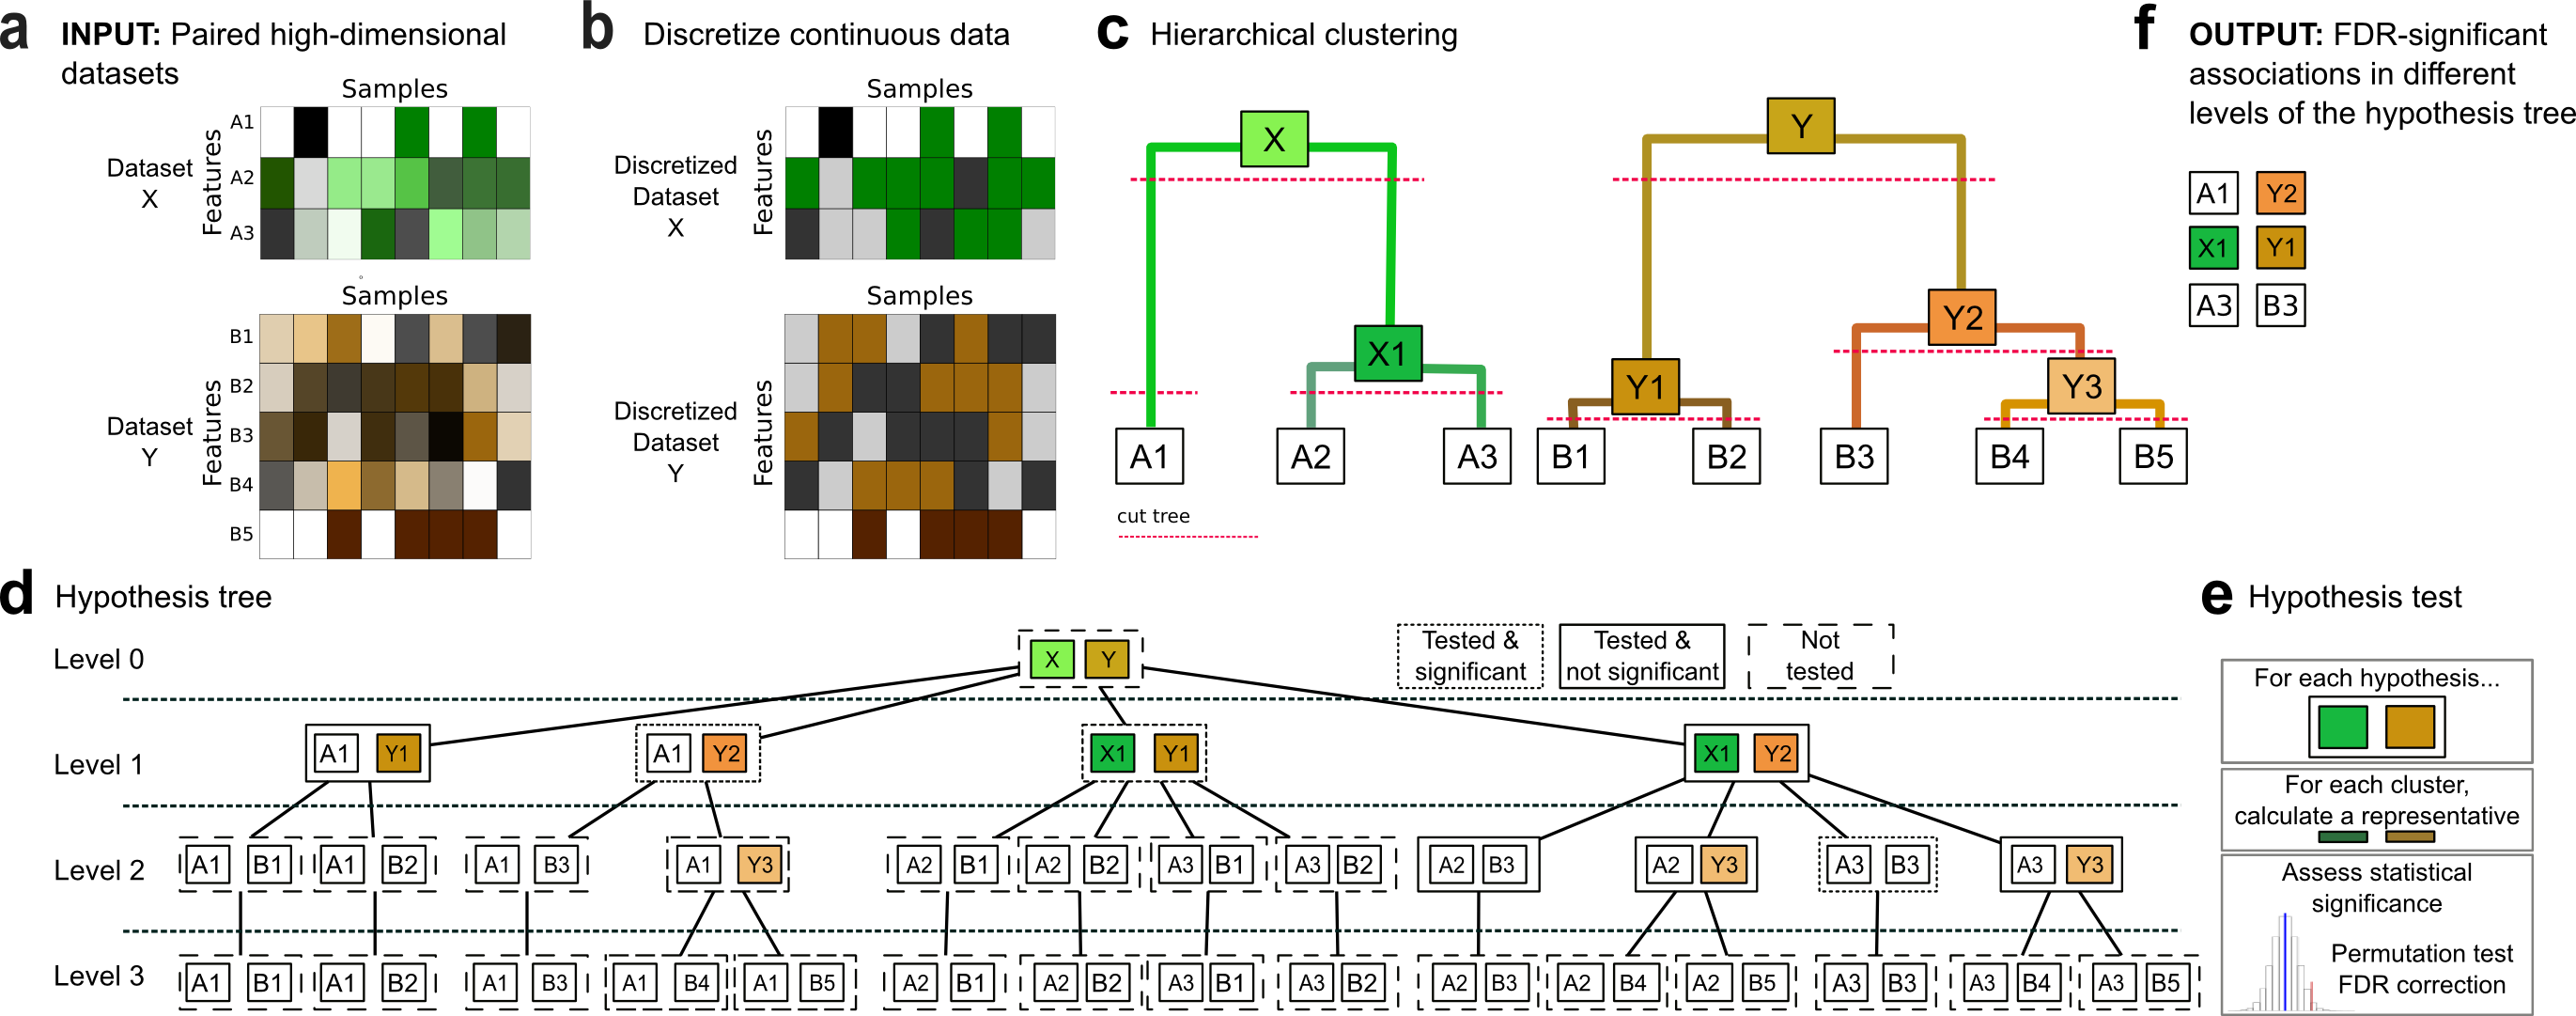
HAllA is an end-to-end statistical method for Hierarchical All-against-All discovery of significant relationships among data features with high power. HAllA is robust to data type, operating both on continuous and categorical values, and works well both on homogeneous datasets (where all measurements are of the same type, e.g. gene expression microarrays) and on heterogeneous data (containing measurements with different units or types, e.g. patient clinical metadata). Finally, it is also aware of multiple input, multiple output problems, in which data might contain of two (or more) distinct subsets sharing an index (e.g. clinical metadata, genotypes, microarrays, and microbiomes all drawn from the same subjects). In all of these cases, HAllA will identify which pairs of features (genes, microbes, loci, etc.) share statistically significant information, without getting tripped up by high-dimensionality.
For more information on the technical aspects:
User Manual || User Tutorial || Forum
Citation:
Gholamali Rahnavard, Eric A. Franzosa, Lauren J. McIver, Emma Schwager, Jason Lloyd-Price, George Weingart, Yo Sup Moon, Xochitl C. Morgan, Levi Waldron, Curtis Huttenhower, “High-sensitivity pattern discovery in large multi’omic datasets”.

Features
In short, HAllA is like testing for correlation among all pairs of variables
in a high-dimensional dataset, but without tripping over multiple hypothesis
testing, the problem of figuring out what “relation or association” means for different
units or scales, or differentiating between predictor/input or response/output
variables. It’s your one-stop shop for statistical significance!
Its advantages include:
- Generality: HAllA can handle datasets of mixed data types: categorical, binary, continuous, lexical (text strings with or without inherent order)
- Efficiency: Rather than checking all possible possible associations, HAllA prioritizes computation such that only statistically promising candidate variables are tested in detail.
- Reliability: HAllA utilizes hierarchical false discovery correction to limit false discoveries and loss of statistical power attributed to multiple hypothesis testing.
- Extensibility: HAllA is extensible to use different methods so measurement in its steps.
- Similarity measurement it has the following metrics implemented: normalized mutual information (NMI), adjusted mutual information (AMI), mutual information (MI), maximum information coefficient (MIC), discretized mutual information as default, Spearman correlation, Pearson correlation, and distance correlation (DCOR).
- Dimension reduction , decomposition, method uses mediod of clusters as default, and also has principal component analysis (PCA), independent component analysis (ICA), multiple corresponding analysis (MCA), centroid of clusters, partial least square (PLS), canonical component analysis (CCA), kernel principal component analysis (KPCA) implemented as options.
- False discovery rate correction (FDR) methods are included: Benjamini–Hochberg–Yekutieli (BHY) as defualt, Benjamini–Hochberg (BH), Bonferroni.
Requirements
Operating System
* Linux
* Mac OS X (>= 10.7.4)
* Windows
Software
* Python (= 2.7.* or 3.*)
* Numpy (>= 1.9.2)
* Scipy (>= 0.17.1)
* Scikit-learn (>=0.14.1)
* matplotlib (>= 1.5.1)
* Pandas (>=0.18.1)
Installation
- Option 1(Recommended):
‘pip install halla’ - Option2:
- Download and unpack the latest release of HAllA.
- Unpack the HAllA software:
tar -ztvf halla.tar.gz - Move to the HAllA directory :
$ cd halla - Install HAllA:
$ python setup.py install
Note: If you do not have write permissions to ‘/usr/lib/’, then add the option “–user” to the install command. This will install the python package into subdirectories of ‘~/.local’.
How to Run
Basic usage
Type the command:
- General command:
$ halla -X $DATASET1 -Y $DATASET2 --output $OUTPUT_DIR - Example:
$ halla -X X_parabola_F64_S50.txt -Y Y_parabola_F64_S50.txt -o HAllA_OUTPUT
HAllA by default takes two tab-delimited text files as an input, where in each file, each row describes feature (data/metadata) and each column represents an instance. In other words, input X is a D x N matrix where D is the number of dimensions in each instance of the data and N is the number of instances (samples). The “edges” of the matrix should contain labels of the data, if desired.
Note: the input files have the same samples(columns) but features(rows) could be different.
Output files
HAllA by default writes the results to “associations.txt”, a tab-delimited text file as output for significant association:
$OUTPUT_DIR = the output directory
$OUTPUT_DIR/associations.txt
- Each row of the assocation.txt tab-delimited file has the following information for each association:
- association_rank: association are sorted for significancy by low pvalues and high similarity score.
- cluster1: has one or more homogenous features from the first dataset that participate in the association.
- cluster1_similarity_score: this value is correspond to `1 – condensed distance` of cluster in the hierarchy of the first dataset.
- cluster2: has one or more homogenous features from the second dataset that participate in the association.
- cluster2_similarity_score: this value is correspond to `1 – condensed distance` of cluster in the hierarchy of the second dataset.
- pvalue : p-value from Benjamini-Hochberg-Yekutieli approach used to assess the statistical significance of the mutual information distance.
- qvalue: q value calculates after BHY correction for each test.
- similarity_score_between_clusters: is the similarity score of the representatives (medoids) of two clusters in the association.
- HAllA provides several plots as complementary outputs including: hallagram for overall plotting results, diagnostics-plot for each association plotting, and heatmaps of original input datasets.